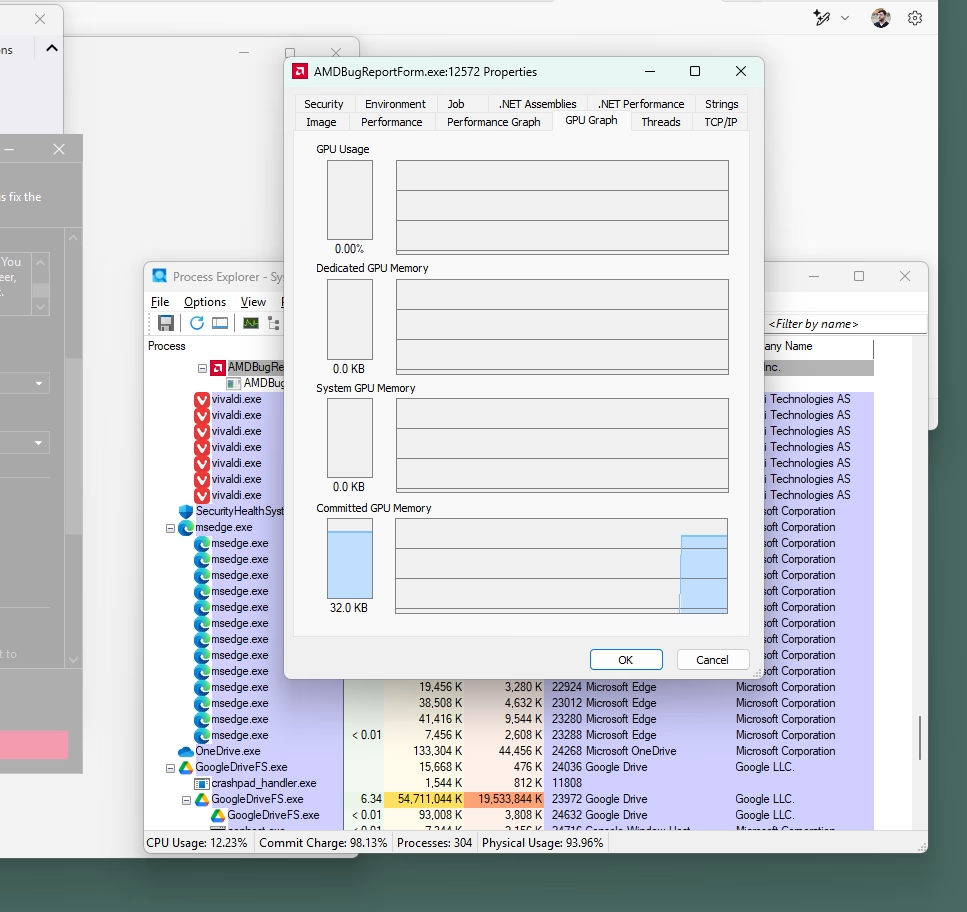
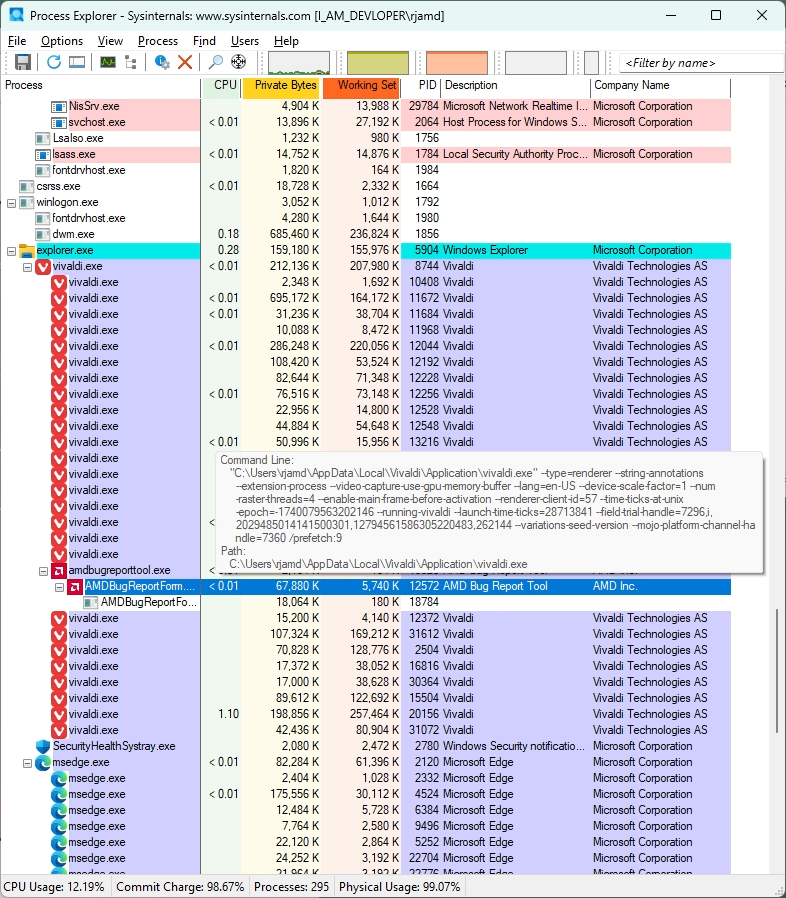
If you want to ever see how much CPU or GPU a particular process is using over time, use Sysinternals Process Explorer (procexp) and find the process, open up its properties, and have a look at the Performance Graph and GPU Graph. This is a feature I didn’t know existed in Procexp, but I have used Procexp in the past to kill tasks that were difficult to identify (chrome.exe, anyone?). Certain apps like Chrome and most browsers create dozens of copies of the same executable name, for their tabs.
If you ever have a window that is misbehaving and you need to identify its process, use the cross-hairs to snipe it on screen. Just drag and drop the cross-hairs onto the app.
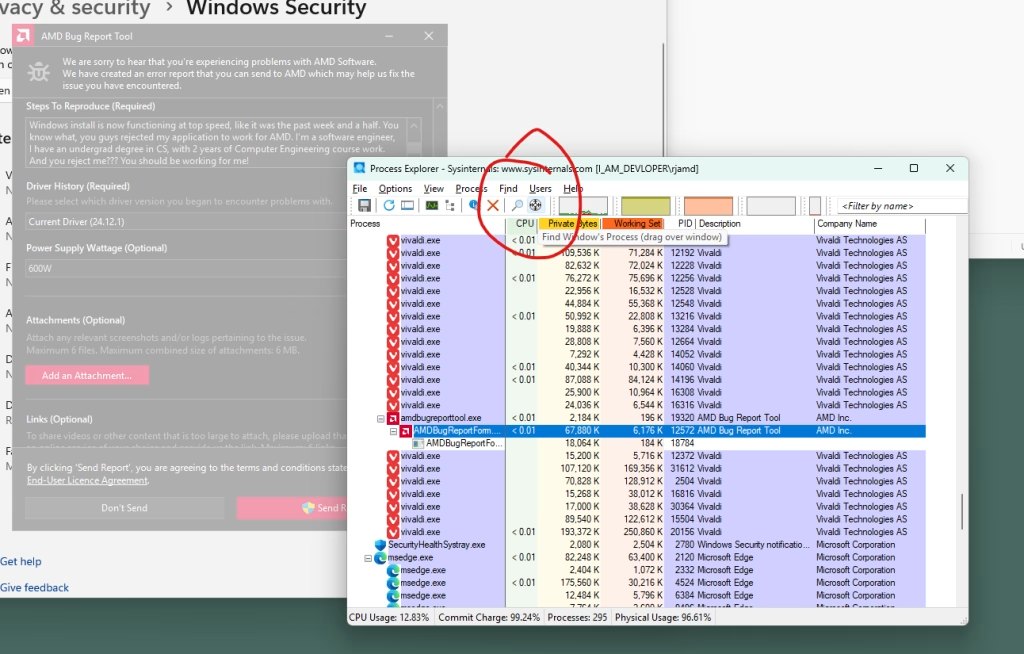
Dragging the cross-hair onto a window will outline the window, and then locate its executable in the process call tree.
Leave a Reply
You must be logged in to post a comment.